
Even as the textiles and clothing T and C sector is struggling to come out of the effects of the Goods and Services Tax (GST) comes certain alarming developments that may seriously impact the sector. This is bound to change the outlook for T and C exports, particularly garments during the current fiscal (2017- 18). Already, the sector has been hit by Britain’s exit from the European Union (EU) a few months ago and slow global demand.
Of immediate concern is the GSP plus benefit accorded to Sri Lanka by the EU facilitating duty – free entry of certain specified textile products, including garments, in the EU. Sri Lanka is among the 12 countries that receive this treatment. India does not get this dispensation. What is surprising is that India’s proposed free trade agreement (FTA) with the EU continues to be shrouded in uncertainty. For instance, issues such as import of automobiles, liquor etc as well as restrictions on the movement of Indian professionals in the EU are yet to be sorted out. All this when Vietnam is to set to sign an FTA with the EU to take effect from January 1, 2018.
Bangladesh is already receiving the benefit of duty free entry of its garments in the EU, being categorized as a least – developed country (LDC). It has also been made eligible to supply garments to India, duty free, under an FTA between the two signed a few years ago.
Vietnam was a signatory to the Trans Pacific Partnership Agreement (TPP). With the new US President Donald Trump deciding to back out of TPP, the threat perception from Vietnam on India’s garment exports has waned. But Vietnam’s proposed FTA with the EU has only strengthened fears of a severe competition to India. Unlike India, Vietnam has achieved economies of scale by setting up large size garment factories.

What has further accentuated the situation is the competition posed by under developed countries such as Myanmar and Cambodia. Myanmar is trying to increase its exports which are worth about one billion. Ethiopia is getting duty- free benefits from both the US and the EU in terms of an agreement with the two countries. Wages in Ethiopia are as low as dollar 50 a month, helping it to achieve a competitive edge in the global market.
Amidst these disturbing developments, there is cheerful news for the T and C industry. China is gradually vacating the global market in respect of garments. Even if India is able to grab a 10 per cent share it would greatly augment its Forex earnings will the T and C Industry rise to the occasion? China garment exports globally are currently valued at $173 bn to $174 bn.
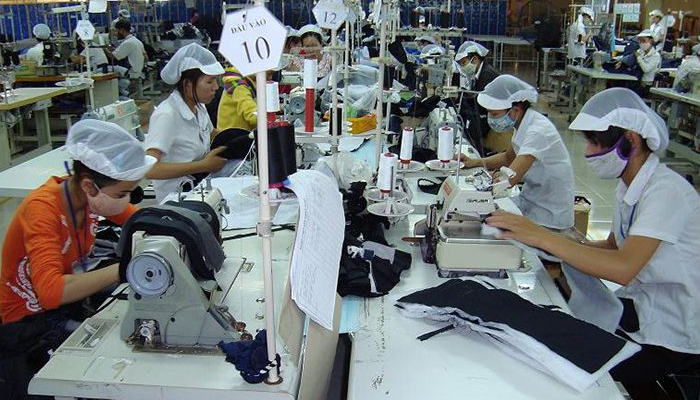
Now look at the outlook for knitwear exports from the Tiruppur region in Tamil Nadu. These exports are valued at about dollar one billion in the first quarter of the 2017-18 fiscal compared to the same period last year, says Tirupur Exporters Association Executive Secretary Sakthivel. The region exports nearly 99 per cent of knitwear exports which include T-shirts. There is no increase in exports in the above period due to slowing demand but the industry is awaiting orders and exports will pick up from August onward, adds Sakthivel.
The region’s total knitwear exports rose steadily from $5.56 bn in 2012-13 to $6.68 bn in 2013-14 to $7.62 bn in 2014-15 to $7.66 bn in 2015-16 and $8.27 bn in 2016-17. But the region lacks proper infrastructure facilities, particularly housing and R&D. The State Government must address this issue, says Raja Shanmugam, TEA President. India’s global share of exports is 3.86 per cent, of which Tiruppur accounts for two per cent.
The Duty Draw-back scheme will continue till September. After that the draw back rate will be pegged at 2 per cent. There will no refund of excise and service tax now known as GST. The loss on this account is said to be around 5 per cent, according to exporters.
A destination wise analysis of knitwear exports shows that total exports to all countries stood at Rs. 55,440 cr in 2016-17, up from Rs. 50,150 cr in the preceding year. To the EU countries (excluding the UK) exports rose from Rs. 13,876 cr to Rs. 14,679 cr. Total exports had shown a steady increase, from Rs. 22,556 cr in 2010-11 to Rs. 27,638 cr in 2011-12 to Rs. 30,238 cr in 2012-13 to Rs. 40,339 cr in 2013-14 to Rs. 4,680 cr in 2014-15 to Rs 50,150 cr in 2015-16, according to data compiled by TEA. UAE accounted for Rs. 14,923 cr, a substantial increase over the Rs. 10,862 cr in 2015-16. Exports to the US rose from Rs. 10,968 cr to Rs. 11,432 cr in this period.
India’s T and C Sector is considered one of the robust across all sectors due to its advantage in terms of the presence of the entire value chain and availability of all kinds of raw materials demanded by manufacturers besides catering to the domestic market, India has a huge surplus output so as to meet the global demand. Garments and other textile items had the largest share in total T and C exports in 2015- 16. Garment exports accounted for 46.3 pe rcent of T and C exports, while other textile items had a share of 35 per cent during the same year.
T and C goods are exported to almost all countries of the globe. More than 175 countries are covered. However, most of the advanced, high income and industrial economics have a large share in India’s T and C exports. In 2015-16, a similar trend continued and among India’s top 10 T&C export destinations, five were advanced and the rest five were high income and industrial economies. These top ten economies accounted for 65 per cent of this country’s total T and C exports, while rest of the destination economies accounted for 35 per cent of total exports during 2015-16.

The US is India’s top exports destination for T and C which accounted for 20.5 per cent share of India’s total T and C exports. The other destinations are UAE (12.1 per cent), Ukraine (6.5 per cent), Bangladesh (5.7 per cent), China (5.4 per cent) and Germany (4.6 per cent).


